
What Is the Difference Between NTA and DLS?
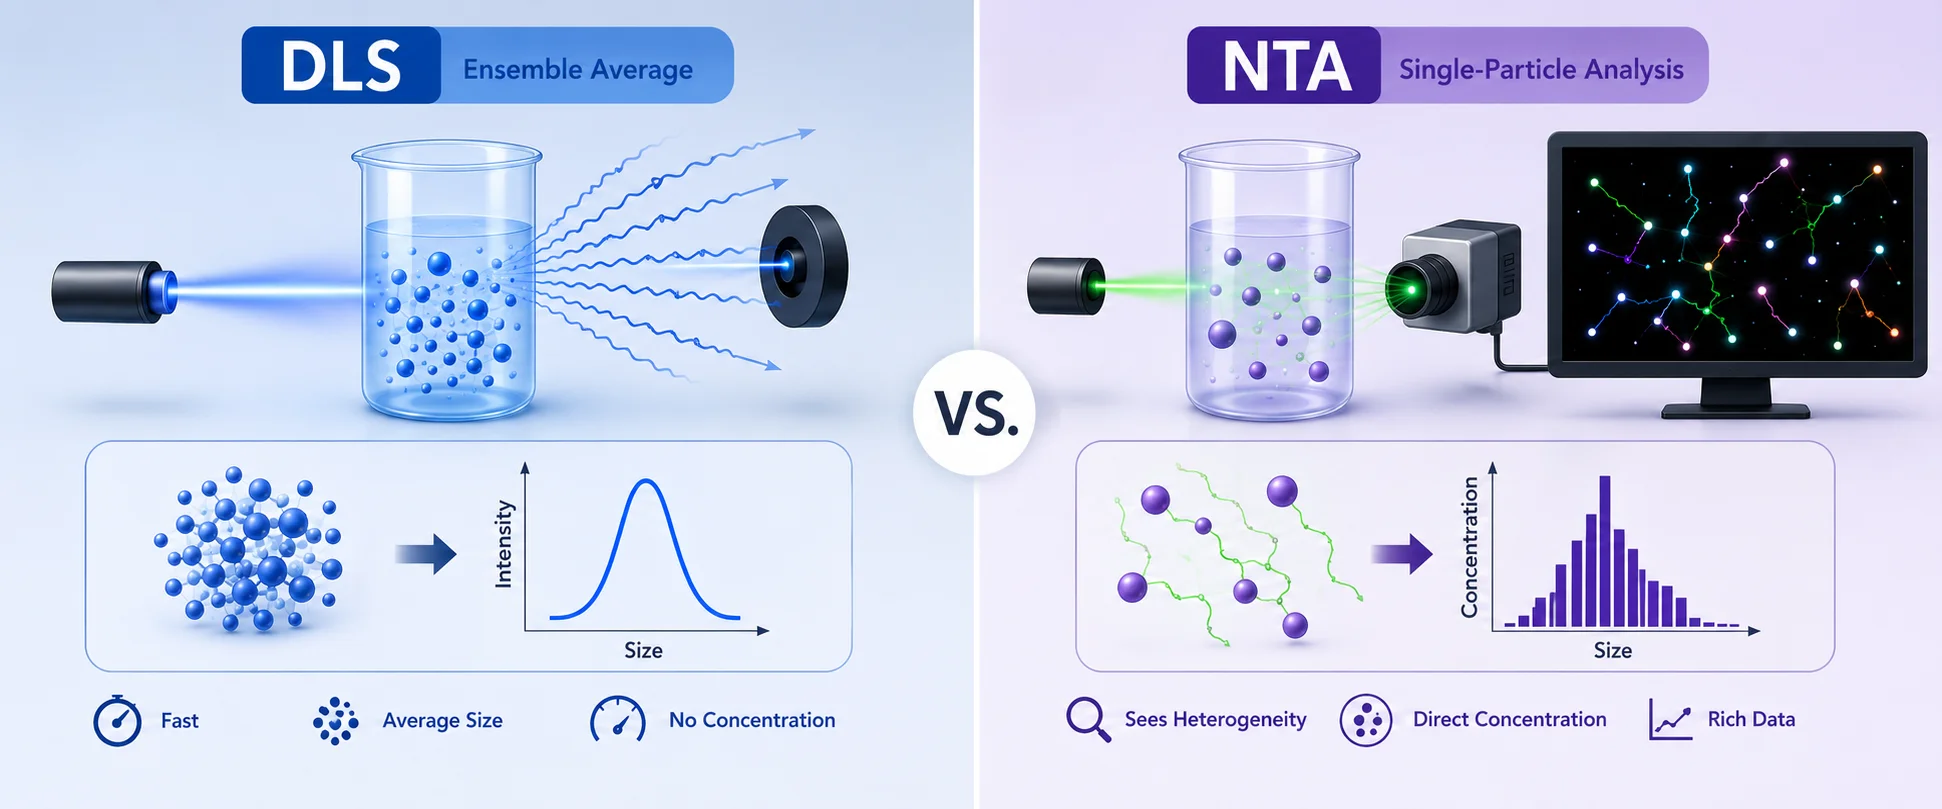
Dynamic Light Scattering (DLS) and Nanoparticle Tracking Analysis (NTA) are both widely used techniques for nanoparticle size measurement, and both rely on light scattered by particles in suspension, but they answer different questions. DLS offers fast ensemble averages; NTA provides particle-by-particle resolution and direct concentration data. Researchers often use both during formulation and process development, applying each where its strengths matter most. At Hyperion Analytical, we built Envision NTA after years of working with real samples where heterogeneity, aggregates, and low-abundance populations mattered more than a single mean size.
What Is Nanoparticle Tracking Analysis (NTA)?
NTA visualizes and tracks individual particles moving in solution as they undergo Brownian motion, calculating a size and concentration value for every particle measured rather than a single averaged result for the sample.
What Is Dynamic Light Scattering (DLS)?
DLS measures intensity fluctuations from an ensemble of particles simultaneously, reporting a single intensity-weighted average size (the z-average) rather than data on individual particles. It’s a fast, low-sample-volume technique best suited to relatively uniform samples.
NTA vs. DLS: Feature Comparison Table
| NTA | DLS | |
| Measurement approach | Individual particle tracking | Ensemble average |
| Reported result | Number-weighted size distribution | Intensity-weighted z-average + polydispersity index (PDI) |
| Concentration data | Direct, absolute (particles/mL) | Not directly measured |
| Typical measurement time | Several minutes per sample | ~30 seconds to 2 minutes |
| Sample volume | ~200 μL | ~3–12 μL |
| Best suited to | Polydisperse, heterogeneous samples | Monodisperse samples (PDI below ~0.15) |
| Lower size limit | ~30–40 nm (refractive-index dependent) | ~1 nm under optimal conditions |
| Aggregate sensitivity | Reports aggregates as a distinct subpopulation | Can be dominated/skewed by a small number of aggregates |
How NTA and DLS Work: Core Principles
Dynamic Light Scattering (DLS)
When light hits a suspension, particles scatter photons in all directions. As particles move randomly through Brownian motion, scattered light intensity fluctuates over time. A DLS instrument records these fluctuations with a photodetector positioned at a fixed angle, typically 90 or 173 degrees, then correlates the intensity changes to extract a diffusion coefficient -converted to a hydrodynamic diameter using the Stokes-Einstein equation. Measurements complete quickly, typically in 30 seconds to 2 minutes, with the result reported as a z-average diameter and polydispersity index (PDI).
The z-average is an intensity-weighted mean, and because light-scattering intensity scales with the sixth power of particle diameter, larger particles dominate the signal – a small number of aggregates can significantly skew results, creating real challenges when characterizing heterogeneous samples.
DLS offers real advantages for the right application: measurement speed is exceptional, sample volume requirements are minimal (often just 3–12 μL), and the technique extends to very small particles, detecting species as small as 1 nm under optimal conditions. For monodisperse samples with narrow distributions, DLS provides reliable, reproducible size information with excellent precision — which is why it remains common in early screening and routine checkups. However, the intensity-weighted distribution makes quantitative interpretation difficult for complex samples: the polydispersity index indicates distribution width but doesn’t reveal whether multiple populations exist, and concentration measurement requires calibration or a separate analytical method entirely.
Nanoparticle Tracking Analysis (NTA)
NTA operates on a fundamentally different principle. The system illuminates particles with a laser under conditions that create a scattered light cone visible to a microscope objective, with each particle appearing as a point of light against a dark background. Video frames capture particle positions at high speed, typically 30 frames per second, and software algorithms identify each particle and track its movement across consecutive frames. From displacement data, the system calculates a diffusion coefficient for every single particle, converted to hydrodynamic diameter using the same Stokes-Einstein relationship as DLS.
The fundamental difference is measurement philosophy: DLS analyzes the collective behavior of millions of particles simultaneously, while NTA examines particles one at a time – a distinction with significant consequences for data quality and interpretation. When you run an NTA measurement, you see particles moving, offering insight ensemble methods cannot provide. You observe heterogeneity in real time, and subpopulations become obvious – a formulation containing 95% particles at 80 nm and 5% aggregates at 400 nm displays both populations clearly.
The tracking algorithm follows each particle’s path: fast-moving particles are small, slow-moving particles are large, and the software calculates each tracked particle’s size independently. The result is a number-weighted size distribution where every particle contributes equally regardless of size — a 50 nm particle and a 500 nm particle each count as one particle in the distribution, eliminating the intensity-weighting bias inherent to light-scattering ensemble measurements.
NTA also measures concentration directly by counting particles in a defined volume, yielding absolute concentration in particles per milliliter without calibration. Size and concentration come from a single measurement, resolving distinct subpopulations that an ensemble average would report as one blended value. NTA does require appropriate dilution to avoid overlapping trajectories — practical working concentrations typically range from 10⁷ to 10⁹ particles/mL in the viewing volume.
NTA vs. DLS: Particle Size Distribution
The core practical difference between the two techniques comes down to how each one builds its size result. DLS’s z-average is a single, intensity-weighted number — useful as a fast summary, but incapable of revealing whether a sample contains one population or several. NTA reports every individual particle’s size, producing a full number-weighted distribution that shows the actual shape of a population, including minor subpopulations an intensity-weighted average would flatten out entirely.
NTA vs. DLS: Particle Concentration Measurement
DLS does not directly measure particle concentration – deriving a concentration estimate from DLS data requires calibration or an entirely separate analytical method. NTA measures concentration directly, by counting individually tracked particles within a precisely known measurement volume, yielding an absolute value in particles per milliliter with no calibration standard required. For any application where dose, yield, or particle-number specification matters – not just size – this is a structural difference, not a matter of degree.
NTA vs. DLS: Accuracy for Monodisperse vs. Polydisperse Samples
For genuinely monodisperse samples (PDI below roughly 0.15), DLS and NTA tend to agree well, and DLS’s speed advantage makes it the more practical choice. As polydispersity increases, the two techniques diverge: DLS’s intensity-weighting increasingly overrepresents the largest particles present, while NTA continues reporting each population’s true relative size and abundance. The more heterogeneous the sample, the larger this gap becomes — and the more it matters which technique you’re relying on for a go/no-go decision.
NTA vs. DLS: Advantages and Limitations
| Advantages | Limitations | |
| DLS | Fast (30 sec–2 min); minimal sample volume (3–12 μL); detects particles down to ~1 nm; excellent for monodisperse samples | Intensity-weighted average can be skewed by aggregates; no direct concentration data; cannot reveal multiple populations |
| NTA | Number-weighted distribution reveals true population composition; direct concentration measurement; resolves subpopulations and aggregates individually | Slower per sample (~3–5 min); requires more sample volume (~200 μL); less reliable below ~30 nm depending on refractive index |
When Should You Use NTA?
- Accurate polydisperse characterization — if your formulation contains multiple size populations, subvisible particles, or aggregates, NTA provides quantitative distributions that reveal true composition. Applies to lipid nanoparticles, liposomes, viral vectors, protein aggregates, and any therapeutic where aggregation monitoring is critical.
- Absolute concentration data — dose calculations, formulation stoichiometry, and particle-number specifications require concentration in particles per milliliter, which NTA measures directly. Relevant to cell therapy products, gene delivery vectors, and any formulation where particle dose affects efficacy.
- Quality control for complex formulations — manufacturing consistency depends on detecting subtle changes in size distribution and aggregate content; NTA’s sensitivity to subpopulations suits release testing, stability studies, and process validation, aligning with regulatory expectations for nanomedicine characterization.
- Process development screening — when optimizing lipid ratios, PEG content, or encapsulation methods, NTA’s measurement time allows efficient evaluation of multiple samples per day while maintaining statistical rigor (thousands of tracked particles).
When Should You Use DLS?
- Rapid screening of narrow distributions — DLS provides reliable mean diameters quickly for monodisperse samples with polydispersity indices below 0.15, suitable for monitoring a single population for change, such as protein stability studies or polymer synthesis optimization.
- Small particle measurements — below approximately 30 nm, NTA’s detection limits make measurement unreliable or impossible; DLS characterizes proteins (3–10 nm), polymer micelles (10–30 nm), and other small species effectively.
- Minimal sample volume — when working with extremely limited material (less than 20 μL total), DLS’s lower volume requirement becomes decisive — relevant for precious biologics, early synthetic batches, or samples recovered from microscale reactors.
- High-throughput initial screening — evaluating 50–100 formulations in a day to identify promising candidates favors DLS’s speed advantage; triage quickly, then characterize selected formulations more thoroughly with NTA.
Using NTA and DLS Together for Comprehensive Nanoparticle Characterization
Many research programs benefit from combining both methods: use DLS for rapid screening and NTA for detailed characterization, balancing throughput with data quality. Identify promising formulations quickly with DLS, then verify size distributions and measure concentrations with NTA before advancing candidates to in vivo studies or manufacturing scale-up.
The combination also provides orthogonal validation. If DLS shows a low polydispersity index and NTA confirms a narrow, unimodal distribution, that agreement builds confidence in a formulation’s homogeneity. If the results disagree — DLS shows apparent monodispersity while NTA reveals aggregates — that disagreement is itself valuable information, and worth investigating further before proceeding.
Why Researchers Choose Envision NTA
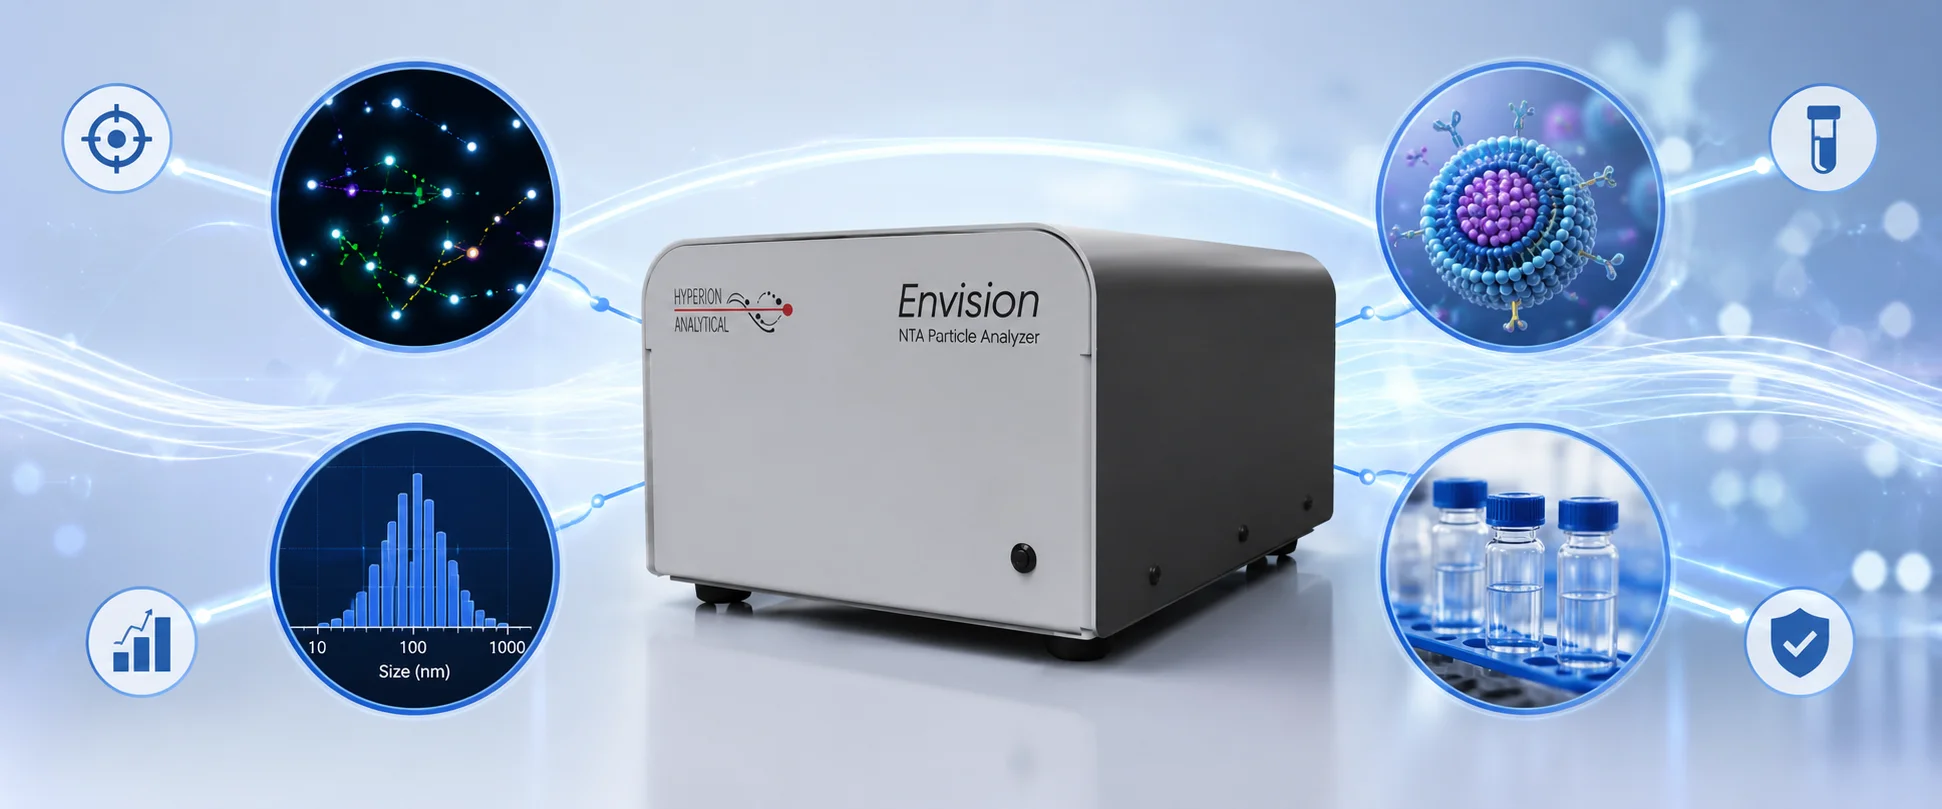
The Envision system from Hyperion Analytical specifically targets the needs of pharmaceutical researchers and quality control laboratories working with therapeutic nanoparticles, combining the fundamental advantages of NTA with practical features that simplify routine use.
- Optical design and measurement quality — Envision uses precisely engineered illumination that maintains stable intensity across the field of view, keeping background noise minimal. This matters when tracking weakly scattering particles, such as lipid nanoparticles or polymer micelles, that can be difficult to visualize with less refined optics.
- Automated sample introduction — Manual injection can introduce variability from user to user or day to day. Envision uses an integrated sample pump with pipette-based loading (corrected — see note above) and a sealed flow cell design, eliminating bubbles and maintaining consistent tracking conditions across measurements.
- Measurement range and fluorescence mode — Envision’s measurement range spans approximately 10–1000 nm, with the practical lower limit dependent on material refractive index (demonstrated to ~30 nm for polystyrene latex). Fluorescence mode extends this further, enabling specific detection of labeled particles — tracking targeted nanoparticles in complex backgrounds, or following encapsulated cargo through biological media, without interference from unlabeled components.
- Simplified maintenance and operation — Cleaning requires only a brief rinse, with no disassembly, keeping measurements moving during quality control sessions across multiple production batches. The system returns to measurement-ready state in minutes.
- Intelligent software features — Real-time feedback on concentration appropriateness, tracking quality, and measurement progress guides users toward optimal results even when relatively new to the technique. Analysis completes automatically once sufficient particles have been tracked, typically 1,000 to 5,000 particles depending on distribution complexity.
Applications of NTA vs. DLS
- Lipid nanoparticles (LNPs) — NTA’s polydisperse resolution is critical for mRNA/gene therapy LNP formulations, where DLS’s ensemble average can mask encapsulation-related size heterogeneity
- Exosomes and extracellular vesicles — biological samples are inherently heterogeneous; NTA distinguishes exosome, microvesicle, and aggregate populations that DLS reports only as a single average
- Viruses and virus-like particles — NTA’s direct concentration measurement supports viral titer and empty/full capsid ratio work that DLS cannot provide
- Drug delivery nanoparticles — formulation development benefits from DLS for rapid early screening, with NTA confirming distribution and concentration before scale-up
- Nanobubbles — NTA’s particle-by-particle approach suits the size and concentration heterogeneity typical of nanobubble populations
Choosing the Right Particle Size Analysis Technique
The decision generally comes down to three questions: Is your sample likely monodisperse or polydisperse? Do you need concentration data, or size alone? And how much sample volume can you spare? For most therapeutic nanoparticle, biological, and formulation development work, NTA’s combination of distribution accuracy and direct concentration measurement outweighs DLS’s speed advantage — but for narrow-distribution samples, very small particles, or extremely volume-limited material, DLS remains the more practical choice. For the full vendor-neutral instrument selection criteria beyond the NTA-vs-DLS decision itself, see our complete guide to choosing an NTA instrument.
Frequently Asked Questions
Can NTA and DLS measure the same samples?
Yes, but each technique provides different information. NTA gives number-weighted distributions while DLS provides intensity-weighted results, making direct comparison challenging for polydisperse samples.
What concentration range works best for NTA measurements?
Optimal concentration in the measurement chamber is 10⁷ to 10⁹ particles/mL. Envision software provides real-time feedback if concentration requires adjustment.
How does temperature affect particle size measurements?
Temperature directly affects viscosity and diffusion rates. Both NTA and DLS require temperature control during measurement for accurate, reproducible results.
Can NTA distinguish between empty and cargo-loaded nanoparticles?
NTA measures hydrodynamic size based on Brownian motion. Size differences may be detectable if cargo substantially affects diameter, but complementary techniques are needed for encapsulation efficiency.
How do buffer conditions affect NTA measurements?
Buffer viscosity affects diffusion rates and calculated sizes. Most pharmaceutical buffers (PBS, HEPES, citrate, and acetate) work well, but viscosity must be known for accurate size determination.
Is NTA suitable for regulatory submissions?
Yes, NTA’s physics-based measurement principle and particle-by-particle approach align with regulatory expectations for nanomedicine characterization and quality control.
How long does a typical NTA measurement take?
Measurement time is typically several minutes per sample — fast enough to support efficient screening across formulation development and quality control workflows, though exact time varies with sample complexity and concentration.
What’s the lower size limit for NTA detection?
For lipid nanoparticles and similar materials, reliable detection typically begins around 30–40 nm, depending on particle refractive index and scattering efficiency.
Why does DLS report a single average while NTA reports a distribution?
DLS measures light scattering from all particles in the sample simultaneously and cannot separate individual contributions, so it reports one intensity-weighted average. NTA visually tracks and measures each particle separately, so it can report a size value for every particle detected — producing a true distribution rather than a summary statistic.
Can I convert a DLS z-average into an NTA-equivalent size distribution?
Not reliably. The z-average is intensity-weighted and skewed toward larger particles, while NTA’s distribution is number-weighted. For a genuinely monodisperse sample the two may align closely, but for a polydisperse sample there’s no accurate mathematical conversion between them — this is precisely why the two techniques can appear to disagree on the same sample.
Does DLS’s polydispersity index (PDI) tell you the same thing as an NTA distribution?
No. PDI is a single number indicating how wide a distribution is, but it can’t tell you why, a high PDI could mean one broad population or multiple distinct populations, and DLS alone can’t distinguish between them. NTA’s particle-by-particle data shows directly whether a sample contains one population or several.
Which technique is more cost-effective for routine use?
This depends on sample type and how the data will be used. DLS instruments and per-sample measurement time are generally lower-cost for routine monodisperse screening, but if your work involves heterogeneous or biological samples, the cost of acting on inaccurate or incomplete DLS data (a missed aggregate population, for example) can outweigh the per-measurement savings.
Do NTA and DLS need to be calibrated the same way?
No. NTA’s absolute measurement approach (based on the Stokes-Einstein equation applied to directly observed particle motion) does not require calibration standards. DLS instruments are also generally calibration-free for the core measurement, but rely more heavily on accurate input parameters (viscosity, refractive index) for reliable results, since the calculation is applied to an aggregate signal rather than individually observed particles.