
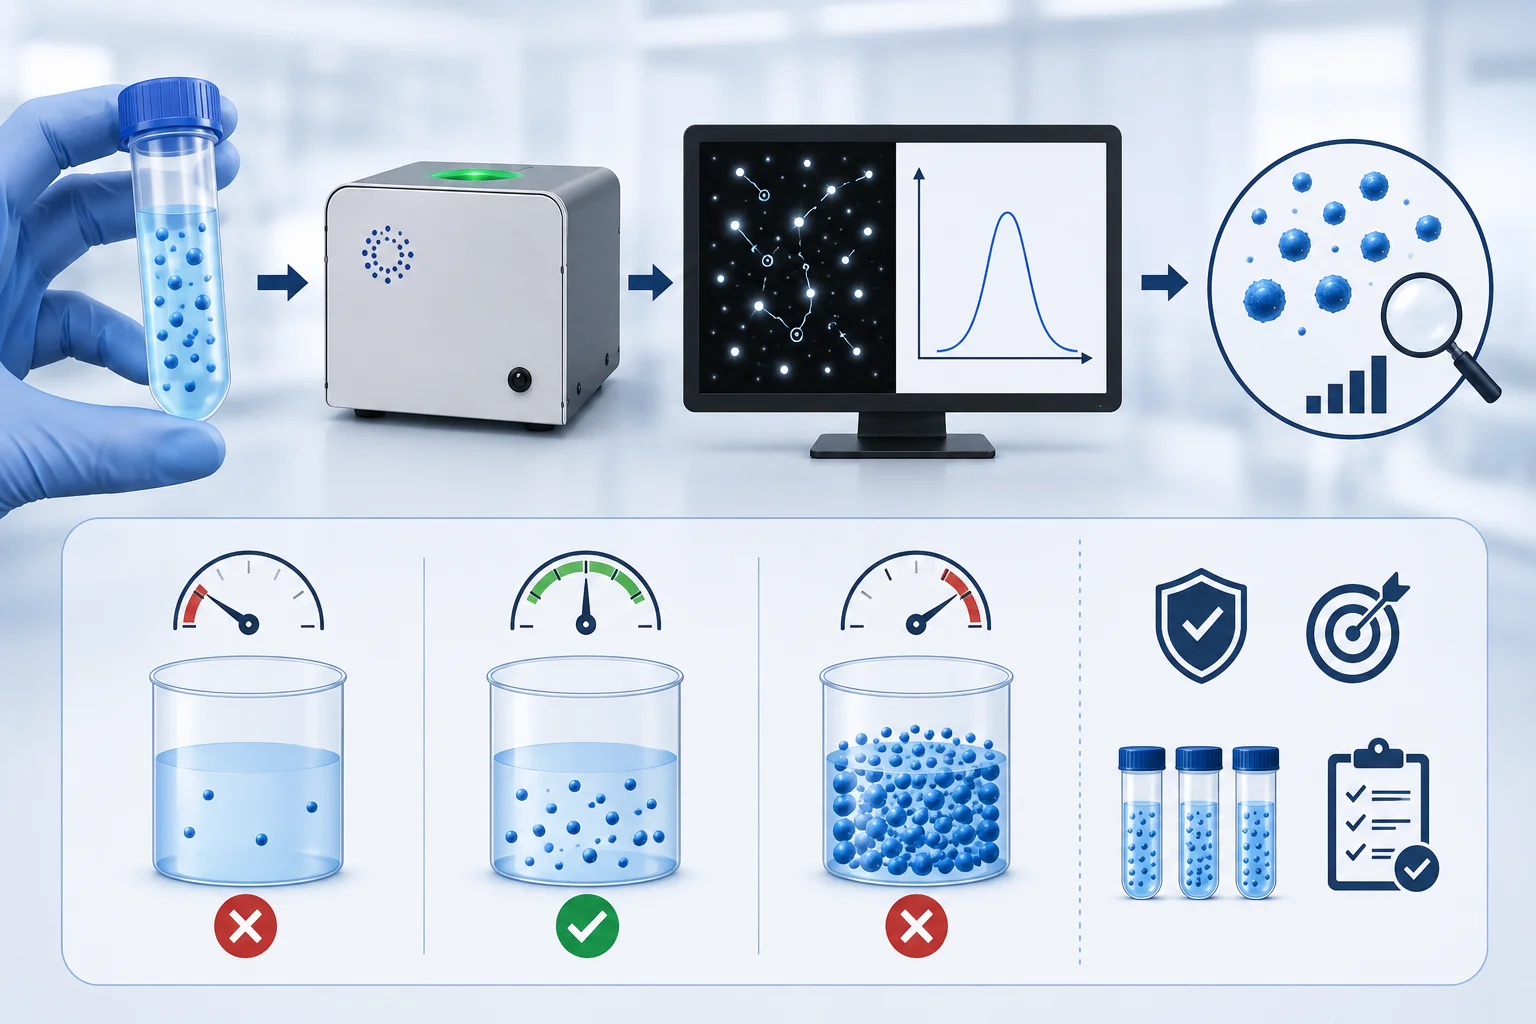
Nanoparticle concentration analysis is the measurement of how many nanoparticles exist within a given volume of sample, typically expressed in particles per milliliter. It’s a distinct measurement from particle size: a sample can have exactly the right size distribution and still fail if the particle count is too high, too low, or inconsistent between batches. Concentration analysis answers a simple but critical question that size data alone cannot: how many particles are actually here?
Why Is Accurate Nanoparticle Concentration Measurement Important?
Accurate nanoparticle concentration measurement is critical to pharmaceutical development, nanomaterial synthesis, and biomedical research. Whether you are formulating drug delivery systems, validating nanoparticle synthesis protocols, or ensuring batch-to-batch consistency, knowing exactly how many particles exist in your sample matters. A formulation with the correct size distribution but incorrect concentration can fail therapeutic targets or produce inconsistent results across manufacturing runs. Traditional methods often require separate instruments for size and concentration data, introducing variability and consuming precious sample volume.
Nanoparticle tracking analysis (NTA) addresses these limitations by providing simultaneous size and concentration measurement from a single analysis. At Hyperion Analytical, we’ve seen how experts struggle with inconsistent concentration data from techniques that depend on indirect measurements or calibration standards. Our Envision NTA instrument was developed specifically to deliver reliable, absolute nanoparticle concentration measurements alongside high-resolution size distributions.
Challenges in Accurate Nanoparticle Concentration Analysis
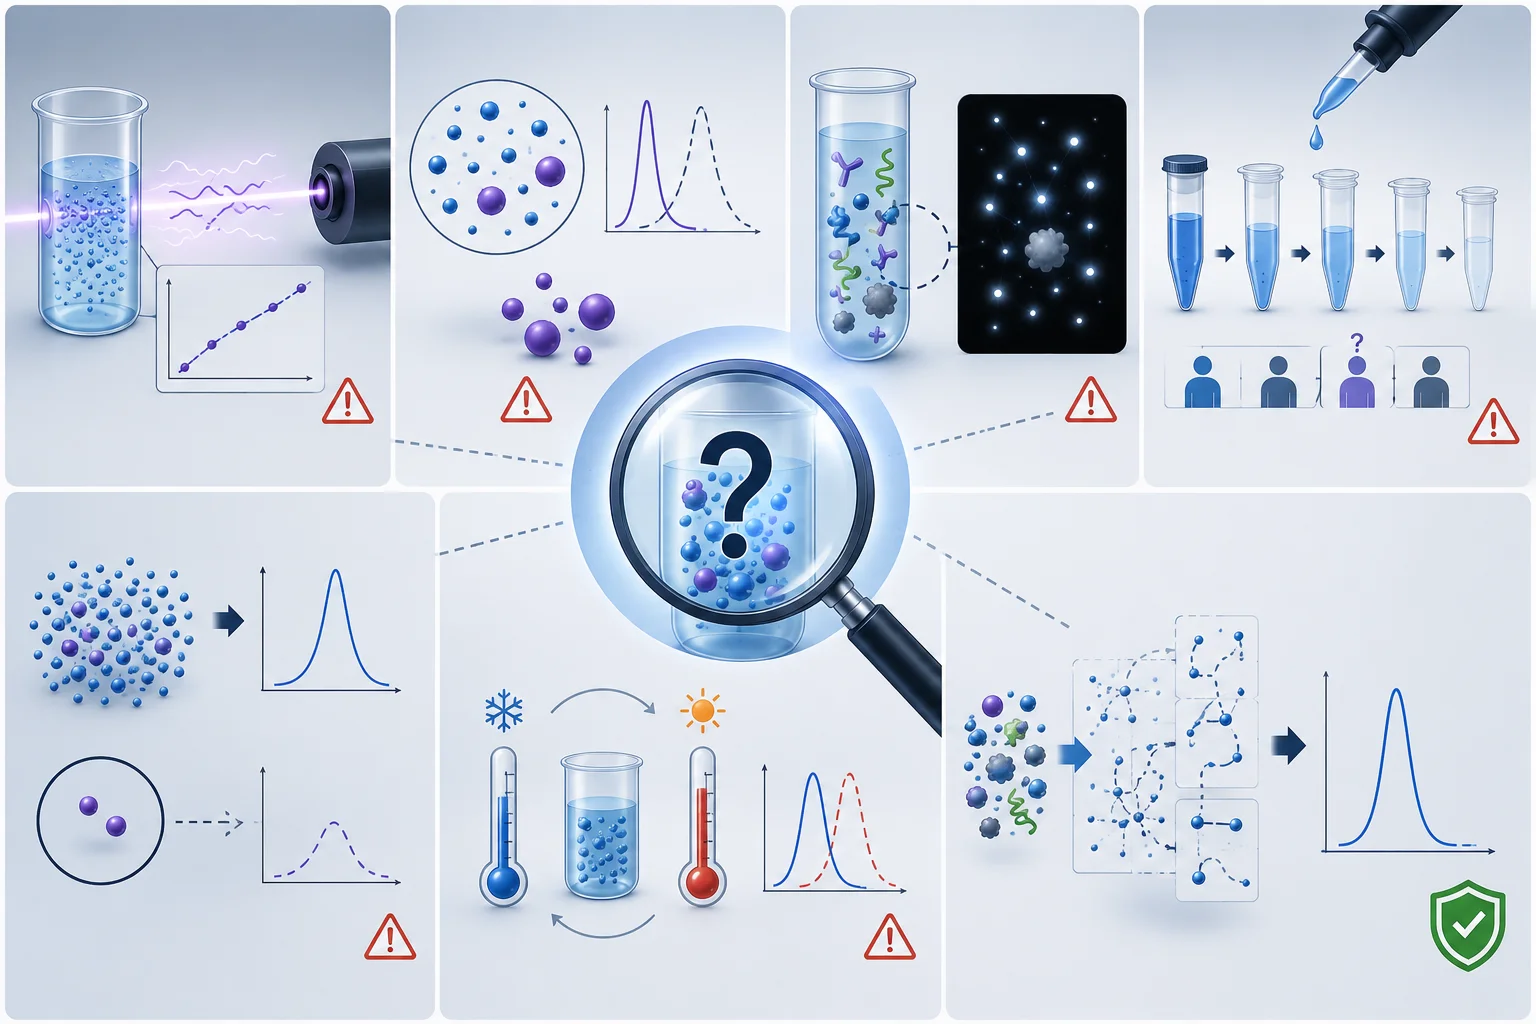
Precise nanoparticle concentration analysis poses substantial analytical challenges, as conventional methods often fail to deliver reliable, representative, or quantitative concentration data.
- Indirect Measurement Dependencies: Many techniques measure light scattering intensity or turbidity, then convert these signals into concentration values using calibration curves or assumed refractive indices. This introduces uncertainty and calibration dependencies compromising accuracy.
- Polydispersity Complications: Different particle sizes scatter light differently. A small population of large aggregates can dominate the signal, masking the true particle count and making ensemble methods unreliable for heterogeneous samples.
- Complex Sample Matrices: Biological samples contain proteins, lipoproteins, and cellular debris that create background scatter. Distinguishing target nanoparticles from this interference requires either extensive sample preparation or advanced detection methods.
- Dilution Errors: Manual dilution introduces operator variability. Some nanoparticle concentration measurement techniques require narrow concentration ranges, necessitating multiple dilution trials before successful measurement. Incorrect dilution propagates directly through all subsequent calculations.
- Subpopulation Detection Limits: Ensemble measurement methods average signals across millions of particles simultaneously. Subpopulations representing 2-5% of the total particles often disappear from the averaged signal, leaving critical aggregates or contaminants unaccounted for.
- Temperature-Dependent Variability: Temperature fluctuations change solution viscosity, altering particle diffusion. Without precise temperature control, concentration values drift between measurements, making reliable comparisons difficult.
NTA addresses these challenges through direct, particle-by-particle observation, providing absolute concentration measurements without calibration curves or mathematical conversions that compound uncertainties.
How Nanoparticle Tracking Analysis (NTA) Measures Particle Concentration
NTA determines concentration by counting particles within a precisely known volume. A laser illuminates a thin layer of liquid in the flow cell; particles scattering light are detected and tracked, and the software knows the exact dimensions of the illuminated volume from optical calibration. Dividing particle count by that known volume gives concentration directly, in particles per milliliter, no calibration curve, standard, or mathematical conversion required. This direct-counting approach is what separates NTA from ensemble techniques that infer concentration indirectly from scattering intensity or turbidity.
What Does Nanoparticle Concentration Analysis Measure?
A single NTA-based concentration measurement provides:
- Absolute particle count, in particles per milliliter, independent of calibration standards
- Population-specific counts, distinguishing monomer particles from aggregates within the same sample
- Concentration alongside size, in the same measurement — revealing whether a concentration change is caused by aggregation, particle loss, or a dilution error
- Labeled-population counts, in fluorescence mode, isolating a specific tagged population within a mixed or biological sample
Benefits of Using NTA for Nanoparticle Concentration Analysis
Our Envision NTA system brings advantages to nanoparticle concentration analysis workflows.
- Accurate Absolute Particle Counting: Envision NTA directly counts individual nanoparticles within a defined measurement volume to determine absolute concentration in particles per milliliter. This calibration-free approach eliminates dependence on standards or assumptions. Envision’s high signal-to-noise optics ensure accurate particle detection, delivering reliable concentration data for dose determination and manufacturing control.
- Extended Concentration Range with Lower Detection Limits: The superior signal-to-noise ratio of Envision concentration analyzer enables reliable detection and counting across a broad nanoparticle concentration measurement range of approximately 10⁵ to 10⁹ particles/mL. This ensures accurate concentration analysis for both dilute and highly concentrated samples within a single workflow. The extended dynamic range delivers complete, representative particle counts rather than partial or biased concentration data, supporting robust quantitative analysis across research and manufacturing applications.
- Reliable Concentration Data for Fluorescent Samples: Lower laser intensity in fluorescence mode prevents photobleaching during measurement. When other systems cause rapid fluorophore degradation within seconds, Envision maintains fluorescent signal stability for tens of seconds to minutes. This extended tracking time provides sufficient data for statistically robust concentration measurements of labeled particles, even in complex biological matrices where specific population counting is essential.
- Reproducible Concentration Measurements Across Users and Labs: Consistent sample volumes delivered by the built-in pump, optimized optics, and automated workflows minimize user-dependent variables. The sealed flow cell eliminates bubble formation that creates false particle counts. Concentration analysis shows excellent repeatability between operators and across laboratories. This reproducibility is critical for quality control applications where batch-to-batch concentration consistency must be demonstrated.
- High Statistical Confidence in Particle Counts: By collecting data from thousands of individual particles under optimal optical conditions, Envision generates concentration values with high statistical confidence. The sharply focused imaging and minimal background noise mean particles are consistently detected across the entire measurement volume. Larger sample populations tracked per measurement reduce counting uncertainty compared to techniques that analyze only a few hundred particles.
- Simultaneous Size and Concentration for Complete Characterization: Understanding both particle count and size distribution from a single measurement reveals whether concentration changes result from aggregation, particle loss, or dilution errors. This dual output is particularly valuable during formulation development and stability studies where you need to distinguish between fewer particles and particles clustering together. Having both parameters eliminates the need for separate assays that consume additional sample and introduce variability.
- Fast Concentration Screening for Process Development: Automated sample loading, measurement, and cleaning cycles enable rapid throughput. Concentration analysis completes in minutes, allowing you to screen multiple formulations daily during process optimization. The streamlined workflow lets you monitor concentration changes across synthesis conditions, purification steps, or storage time points without creating experimental bottlenecks.
- Aggregate Detection in Concentration Analysis: The extended dynamic range detects both monomers and aggregates simultaneously. Concentration analysis includes separate counts for different-sized populations, revealing the percentage of aggregated particles. Early detection of even 1-3% aggregate formation helps you identify instability before it compromises product quality. This population-specific counting is impossible with ensemble techniques that report only average values.
- Minimal Sample Consumption for Concentration Determination: Approximately 200 microliters suffice for complete size and concentration analysis. This small volume requirement helps preserve precious samples during early research, when material is limited. The ability to obtain reliable concentration data from small sample volumes accelerates development timelines by reducing the need to produce large sample batches.
Key Features of the Envision NTA Instrument for Concentration Analysis
While the full instrument specification is available on Nanoparticle Size Analyzer page, the features most relevant to concentration work specifically are:
- 10⁵–10⁹ particles/mL detectable range — among the widest dynamic ranges available for a single-workflow measurement
- ~40 nL analyzed sample volume per measurement, enabling reliable statistics from as little as 200 μL of total sample
- Calibration-free, absolute counting — no standards or reference curves required
- Automated cleaning between samples, preventing carryover that would otherwise skew sequential concentration readings
Factors That Affect Nanoparticle Concentration Measurement Accuracy
Several factors influence the accuracy of any NTA-based concentration measurement:
- Sample concentration range — must fall within the optimal window where particle images don’t overlap significantly; too many particles create tracking errors, too few provide inadequate statistics
- Temperature control — affects solution viscosity and particle diffusion rates; the Envision system maintains controlled temperature throughout measurement
- Bubbles or debris — interfere with tracking and skew concentration calculations, making proper sample handling essential
- Dilution accuracy — incorrect dilution factors propagate directly into final concentration values, making accurate dilution records essential
- Camera settings and detection thresholds — affect which particles are counted, so consistent measurement protocols improve reproducibility across operators and sessions
Typical Nanoparticle Concentration Measurement Workflow
- Sample preparation — dilute the sample if needed to fall within the optimal 10⁷–10⁹ particles/mL working range for a single measurement
- Sample loading — approximately 200 μL loaded by pipette into the sealed flow cell
- Real-time concentration feedback — the operator observes live particle tracks, confirming appropriate concentration (not overcrowded, not too sparse) before committing to a full measurement
- Automated measurement — the system captures and tracks particles within the defined measurement volume over the measurement period
- Concentration calculation — particle count is divided by the known illuminated volume to yield an absolute concentration value, reported alongside the size distribution from the same run
- Automated cleaning — the system rinses between samples, preventing carryover that would bias sequential measurements
Nanoparticle Concentration Analysis vs. Other Measurement Techniques
Several techniques can provide concentration data, each with different tradeoffs:
| Technique | Concentration Data | Sample State | Key Limitation |
|---|---|---|---|
| NTA | Direct particle count, absolute | Liquid suspension | Requires particles within the instrument’s detectable size range |
| DLS | Not directly measured (size-only, ensemble) | Liquid suspension | No true concentration output; see our NTA vs. DLS comparison. |
| Flow Cytometry | Direct event count | Liquid suspension | Limited resolution below approximately 100–200 nm without specialized small-particle configurations. |
| UV-Vis Spectrophotometry | Indirect, via absorbance and assumed extinction coefficient | Liquid suspension | Requires known optical properties; cannot resolve mixed populations. |
| Coulter Counter (Electrical Sensing Zone) | Direct particle count | Liquid suspension through an aperture | Practical lower size limit typically well above the nanoparticle range for standard apertures. |
NTA’s combination of direct particle counting and applicability across the full 10 to 1000 nm nanoparticle range makes it broadly useful where flow cytometry’s resolution or Coulter counting’s size floor falls short. Each technique remains valuable for the sample types and size ranges to which it is best suited.
Choosing the Right Nanoparticle Concentration Analyzer
The criteria that matter most when evaluating an instrument specifically for concentration work:
- Dynamic range – how wide a concentration range (dilute to concentrated) the instrument can measure without extensive dilution trials
- Calibration requirements – whether concentration is measured directly or inferred through calibration curves and assumptions
- Aggregate resolution – whether the instrument can distinguish monomer and aggregate populations, or only reports a single averaged value
- Sample volume requirements – important when working with limited or precious samples
- Reproducibility across operators – critical for any quality control application
Why Researchers Choose Hyperion Analytical
Hyperion Analytical’s team brings decades of combined experience in materials science, chemistry, and analytical instrumentation to every Envision deployment, backed by free technical support during the warranty period and optional maintenance, service, and IQ/OQ/PQ contracts.
Key Applications of Nanoparticle Concentration Analysis
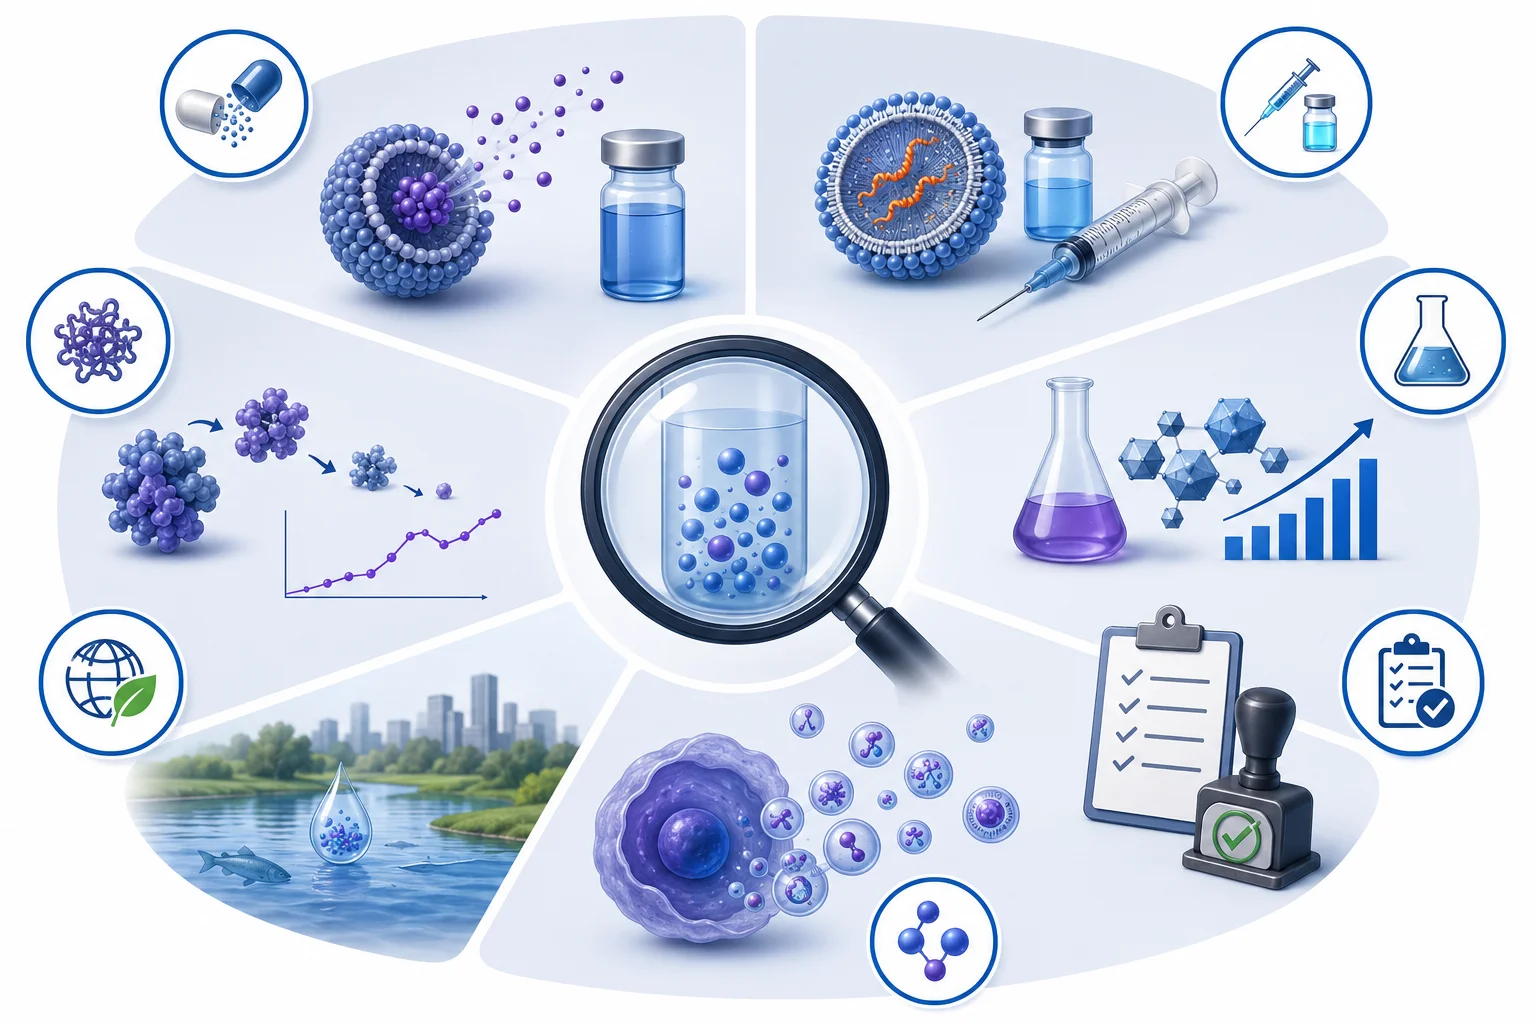
Concentration analysis plays a critical role across diverse research and manufacturing contexts.
- Drug Delivery System Development: Precise nanoparticle concentration analysis is essential for drug delivery formulations, as concentration determines dose and therapeutic consistency. During formulation screening and scale-up, nanoparticle tracking analysis (NTA) provides particle counts alongside size data, enabling rapid comparison of synthesis conditions and early detection of batch-to-batch concentration deviations.
- Vaccine Formulation and Production: Recent vaccine development efforts highlighted the importance of nanoparticle characterization. mRNA vaccines rely on lipid nanoparticles with specific size and concentration parameters. Batch release criteria include particle concentration limits. NTA verifies that each manufacturing batch meets specifications. During storage stability studies, concentration monitoring detects particle loss from aggregation or degradation. This information guides shelf-life determinations and storage condition recommendations.
- Nanomaterial Synthesis Optimization: Researchers developing novel nanomaterials need feedback on synthesis efficiency. How many particles formed? What fraction aggregated? Did the reaction conditions produce the expected yield? Concentration analysis answers these questions immediately. By measuring samples at different reaction time points, you can track particle formation kinetics and optimize synthesis parameters. Comparing concentration before and after purification steps reveals recovery efficiency and helps identify material losses.
- Quality Control and Regulatory Compliance: Pharmaceutical manufacturers face stringent quality requirements. Regulatory agencies expect thorough nanoparticle characterization including particle concentration. NTA provides quantitative, reproducible data that supports submissions. Establishing critical quality attributes during product development requires understanding acceptable concentration ranges. Manufacturing must then demonstrate consistent performance within those ranges. NTA measurements document batch-to-batch consistency and support validation studies required for regulatory approval.
- Exosome and Extracellular Vesicle Research: Biological nanoparticles like exosomes are investigated for diagnostic and therapeutic applications. Concentration analysis tells you how many vesicles cells secrete under different conditions. Comparing vesicle yields from different cell lines or culture conditions guides production optimization. Purification protocols must preserve vesicle integrity while achieving sufficient concentration for downstream applications. NTA monitors both factors simultaneously, helping you refine isolation methods.
- Environmental and Toxicology Studies: Understanding nanoparticle behavior in environmental or biological systems requires knowing exposure concentrations. Too high, and you might observe artifacts from particle crowding. Too low, and subtle effects disappear. NTA establishes actual particle concentrations in test systems, supporting dose-response studies and risk assessment. Following how nanoparticle concentration changes over time in simulated environmental conditions reveals aggregation, dissolution, or transformation processes.
- Protein Aggregation Analysis: Biopharmaceutical development includes monitoring protein aggregation. Some protein aggregates fall into the size range accessible to NTA (typically 100 nm and larger). Concentration analysis tracks aggregate formation during formulation studies, stress testing, or storage. Early detection of low-level aggregation prevents problems during manufacturing scale-up or long-term storage.
Frequently Asked Questions (FAQs)
How does NTA calculate particle concentration?
NTA determines concentration by counting particles in a precisely known volume. The laser illuminates a thin layer of liquid in the flow cell. Particles scattering light are detected and tracked. The software knows the exact dimensions of the illuminated volume from optical calibration. Dividing particle count by volume gives concentration in particles per milliliter.
What factors affect concentration measurement accuracy in NTA?
Several factors influence accuracy. Sample concentration must fall within the optimal range where particle images don’t overlap significantly. Too many particles create tracking errors. Too few provide inadequate statistics. Temperature affects solution viscosity and particle diffusion rates. The Envision system maintains controlled temperature during measurement. Bubbles or debris in the sample interfere with tracking and skew concentration calculations, so proper sample handling matters. Incorrect dilution factors propagate directly into final concentration values, making accurate dilution records essential. Camera settings and detection thresholds can affect which particles are counted, so consistent measurement protocols improve reproducibility.
Can NTA measure concentration in samples containing multiple particle populations?
Yes, but interpretation requires care. NTA tracks all particles within its detection range simultaneously. If your sample contains distinct populations of different sizes or compositions, the software reports total concentration. You can apply size filters during analysis to separate populations by diameter, giving concentration values for specific size ranges. Fluorescence mode provides another separation approach. If only one population is fluorescently labeled, NTA counts just those particles, giving a concentration for the labeled species even in mixed samples. This works well for measuring target nanoparticles in biological fluids or complex formulations.
How do I know if my sample concentration is appropriate for NTA measurement?
The Envision system provides real-time feedback. During measurement setup, you can see particle tracks overlaying the video. If tracks cross frequently or particles appear crowded, the concentration is too high. If you see only a few particles per frame, the concentration is too low for good statistics. At optimal concentrations, many individual particles move independently. Generally, aim for 10^7 to 10^9 particles/mL in the measurement chamber.
How stable are nanoparticle concentration measurements over time or between operators?
Automated operation in the Envision system provides excellent reproducibility. Temperature control, precise flow rates, and standardized measurement protocols minimize variability. Properly maintained instruments produce consistent results across multiple operators and measurement sessions.
What’s the difference between nanoparticle concentration and nanoparticle size measurement?
Size measures how large individual particles are; concentration measures how many particles exist per unit volume. NTA measures both simultaneously from the same sample, which matters because a formulation can have correct size but incorrect concentration or vice-versa and each failure mode requires a different corrective response.
What concentration range can Envision NTA measure?
Envision’s detectable range is approximately 10⁵ to 10⁹ particles/mL. For any single measurement, the optimal working range is narrower typically 10⁷ to 10⁹ particles/mL with samples outside that window typically requiring dilution or concentration adjustment first.
Does concentration measurement require calibration standards?
No. NTA determines concentration through direct particle counting within a known measurement volume, requiring no calibration curves, reference standards, or assumed optical properties unlike techniques such as UV-Vis spectrophotometry that infer concentration indirectly.
Can NTA detect aggregates separately from the main particle population?
Yes. Because NTA measures particles individually rather than as an ensemble average, it can report separate counts for different-sized populations within the same sample distinguishing monomers from aggregates and quantifying the aggregate percentage, which ensemble techniques reporting only a single average value cannot do.
How does NTA concentration measurement compare to flow cytometry?
Both provide direct particle counts, but flow cytometry’s resolution is typically limited below roughly 100–200 nm without specialized small-particle configurations, while NTA resolves particles down to approximately 10–30 nm depending on refractive index making NTA better suited to smaller nanoparticles and exosomes specifically.
Why does my dilution factor matter so much for concentration accuracy?
Because concentration is calculated directly from the particles counted in the sample as measured, any error in the dilution factor applied before measurement propagates linearly into the final reported concentration. Keeping accurate, consistent dilution records is one of the simplest ways to protect data quality in any NTA concentration workflow.