Particle size measurements obtained using Nanoparticle Tracking Analysis and Dynamic Light Scattering are often compared directly. In many cases, the reported particle sizes differ significantly even when the same sample is measured. These differences are frequently attributed to experimental error or instrument performance. In reality, they arise primarily from differences in how particle motion is measured and how statistical measures are generated.
Both techniques rely on Brownian motion and the Stokes Einstein relationship, yet they represent particle populations using fundamentally different statistical approaches. Understanding these differences is essential for correct interpretation of particle size data.
Brownian Motion and the Stokes Einstein Relationship
Particles suspended in a liquid undergo random motion due to collisions with solvent molecules. The diffusion coefficient, D, describing this motion is related to particle size by the Stokes Einstein equation:
D = kBT / 3πηd
Where:
- k_B is the Boltzmann constant
- T is the absolute temperature
- η is the dynamic viscosity of the dispersant
- d is the hydrodynamic particle diameter
Both NTA and DLS determine particle size by measuring diffusion and applying this relationship. The differences between the techniques arise from how diffusion is measured and statistically processed.
Measurement Principle of Nanoparticle Tracking Analysis
Nanoparticle Tracking Analysis measures diffusion by directly observing and tracking individual particles suspended in a liquid. Particles are illuminated by a laser and imaged using a camera. Each particle is identified and tracked across sequential frames. For each particle, displacement over time is measured in two dimensions. From these displacements, an individual diffusion coefficient is calculated and converted into a particle diameter using the Stokes Einstein equation.
Each tracked particle therefore produces a discrete size measurement. The complete dataset consists of a population of individual particle sizes rather than a single ensemble average.
Statistical Representation of NTA Data
Because each particle is measured independently, NTA produces a number weighted particle size distribution by default. Every tracked particle contributes equally to the distribution regardless of its size or scattering intensity.
Common statistical measures derived from NTA data include:
- Mean particle diameter calculated as the arithmetic average of all measured particle sizes
- Mode particle diameter representing the most frequently occurring particle size
- Median particle diameter representing the midpoint of the distribution
- Distribution width reflecting sample heterogeneity
The number weighting inherent to NTA means that the reported distribution directly reflects the particle population present in the sample.
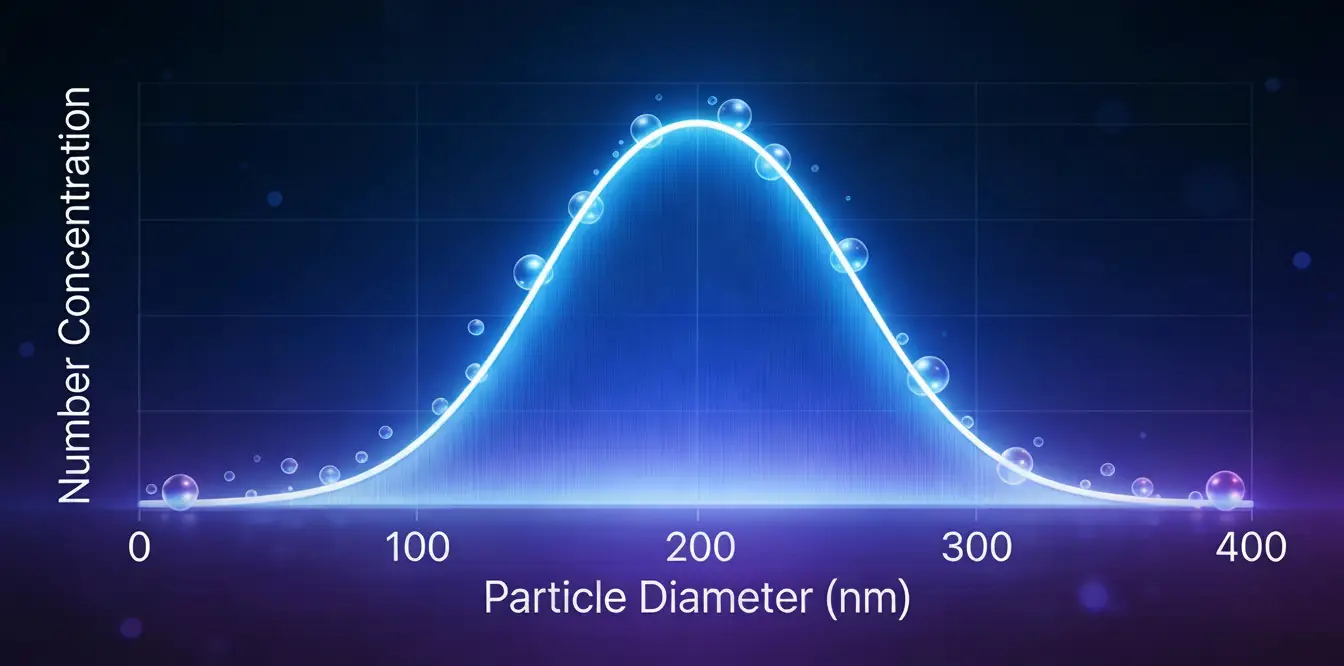
Figure 1. Example of a number weighted particle size distribution obtained by NTA.
Effect of Large Particles on NTA Statistics
In NTA, large particles do not disproportionately influence the distribution unless they are present in significant numbers. A small number of aggregates will appear as a minor population rather than dominating the reported size.
This behavior contrasts strongly with ensemble techniques and is particularly important when measuring heterogeneous or polydisperse samples.
The mode size reported by NTA often provides the most representative value for the dominant particle population.
Measurement Principle of Dynamic Light Scattering
Dynamic Light Scattering measures particle diffusion indirectly by analyzing temporal fluctuations in scattered light intensity. A laser illuminates a population of particles within a defined measurement volume. As particles move due to Brownian motion, the intensity of scattered light fluctuates.
These fluctuations are analyzed using an autocorrelation function, g₂(τ), from which an average diffusion coefficient is extracted. This diffusion coefficient is then converted into an equivalent hydrodynamic diameter using the Stokes Einstein equation.
Unlike NTA, DLS does not measure individual particles and does not generate discrete particle size values.
Intensity Weighting in DLS Measurements
A fundamental characteristic of DLS is the strong dependence of scattering intensity on particle size. For particles much smaller than the wavelength of light, scattering intensity is approximately proportional to the sixth power of particle diameter:
I∝d6
As a result, larger particles scatter orders of magnitude more light than smaller particles. Even a small number of larger particles can dominate the scattering signal. The diffusion coefficient obtained from DLS therefore reflects the particles contributing most strongly to the scattered light rather than the most numerous particles.
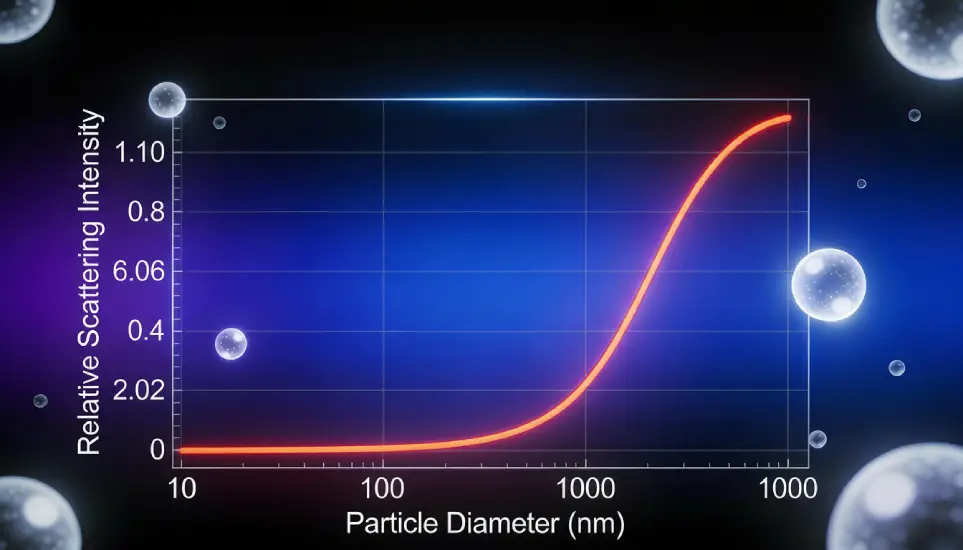
Figure 2. Relative scattering intensity contribution as a function of particle diameter.
Statistical Outputs of Dynamic Light Scattering
The primary particle size parameter reported by DLS is the Z average diameter. This value is derived from cumulant analysis of the autocorrelation function and represents an intensity weighted mean size.
The Z average is highly sensitive to the presence of larger particles or aggregates and should not be interpreted as a number average particle size.
DLS also reports a polydispersity index, which provides an indication of the breadth of the size distribution but does not describe distribution shape or multimodality.
Comparison of NTA and DLS Size Distributions
Because NTA produces number weighted distributions and DLS produces intensity weighted averages, direct comparison of reported particle sizes can be misleading. In samples containing a narrow size distribution, results from NTA and DLS may appear similar. As sample heterogeneity increases, divergence between the techniques becomes more pronounced.
NTA distributions reflect the relative number of particles at each size. DLS results reflect the sizes of particles dominating the scattering signal.
Mean, Mode, and Median Considerations
The mean particle size reported by NTA is calculated directly from individual particle measurements. The mean size reported by DLS is intensity weighted and influenced disproportionately by larger particles. The NTA mode represents the most common particle size in the population and is often the most informative statistic for heterogeneous samples.
Median values may reduce sensitivity to extreme values, but differences in weighting between the techniques still apply. Selection of the appropriate statistical metric is essential when interpreting particle size data.
Influence of Polydispersity on Measurement Outcomes
As polydispersity increases, ensemble averaging becomes less representative of the true particle population. DLS measurements tend to shift toward larger sizes as broader distributions are introduced. NTA maintains resolution of individual particle populations provided sufficient particles are tracked. Multiple populations can be resolved and quantified by number.
This distinction explains why NTA often reports smaller dominant sizes than DLS for the same sample.
Interpretation of Differences Between Techniques
Differences between NTA and DLS results should not be interpreted as measurement errors. They arise from fundamental differences in how particle populations are measured and statistically represented. NTA answers the question of how many particles are present at each size. DLS answers the question of which particles dominate the scattering signal.
Understanding this distinction allows meaningful interpretation of results and appropriate selection of measurement technique.