Particle size analysis data may be presented in several different formats, commonly referred to as distribution bases. When comparing results from different analytical techniques, or even from the same instrument under different conditions, confusion can arise if the data are reported using different distribution bases.

Common distribution bases include concentration, number, area, and volume. A single-particle or counting technique such as Nanoparticle Tracking Analysis (NTA) will naturally give a number-weighted distribution. In the case of dynamic light scattering (DLS), particle size data are naturally reported on an intensity-weighted basis. Because each distribution base weights particle size differently, equivalent datasets can appear significantly different when plotted in different forms. A clear understanding of these distinctions is necessary to ensure meaningful interpretation and comparison of particle size data.
Relationship Between Particle Diameter and Volume
The effect of distribution base on particle size data can be understood by considering the relationship between particle diameter and particle volume. Particle volume scales with the cube of the diameter. As a result, small changes in diameter correspond to large changes in particle volume.
For each tenfold decrease in particle diameter, the number of particles required to maintain an equal total volume increases by a factor of 1000. For example, if a single particle with a diameter of 1 µm is subdivided into particles with a diameter of 0.1 µm (100 nm), the result is 1000 particles with the same combined volume.
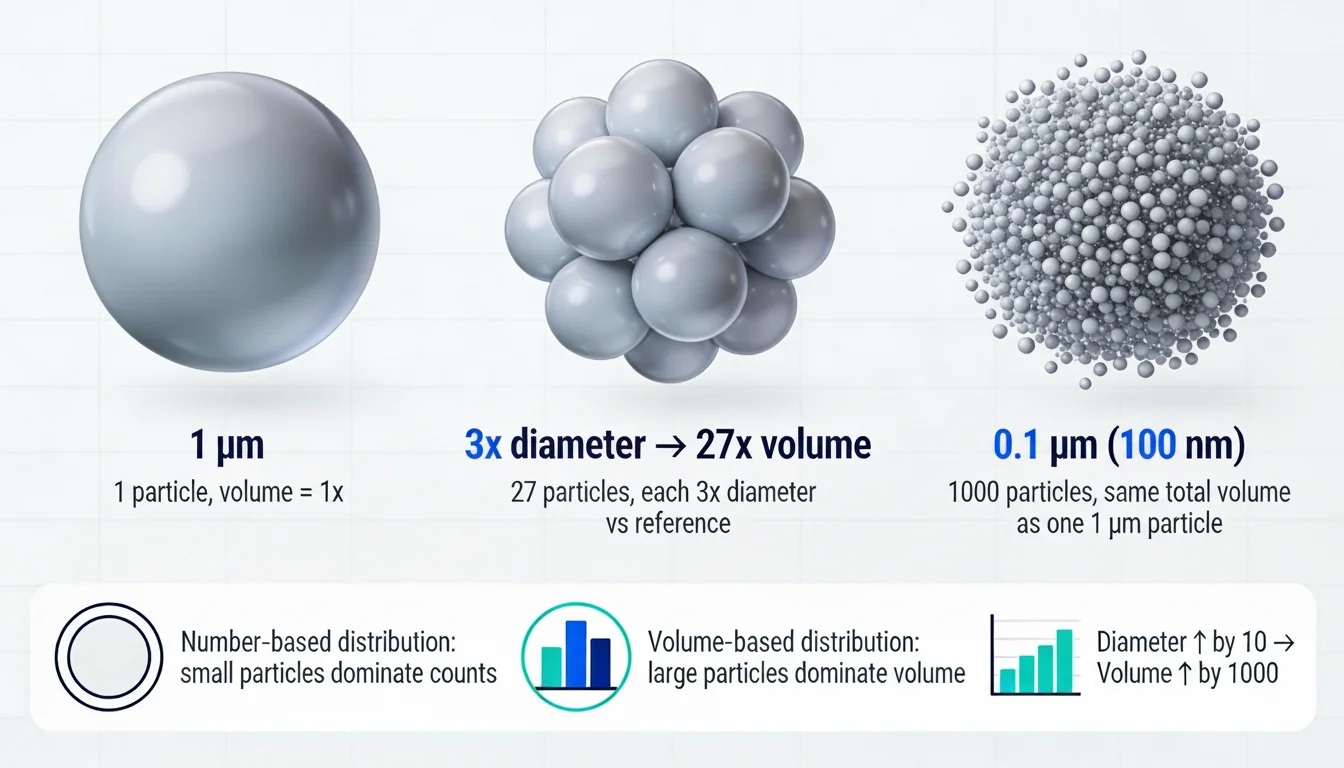
This relationship must be considered when interpreting particle size data. A small population of large particles may contribute little to a number-based distribution and therefore not appear prominently, while a large population of small particles may contribute very little to a volume-based distribution and appear to be insignificant.
An increase in particle diameter by a factor of 3 results in a 27-fold increase in volume, while an increase in diameter by a factor of 10 results in a 1000-fold increase in volume.
Number-Based Distributions from Particle-Resolved Measurements
Analytical techniques that measure individual particles, such as Nanoparticle Tracking Analysis (NTA) or microscopy-based methods, naturally generate number-based particle size distributions. In these distributions, each detected particle contributes equally, regardless of size.
From a measured number-based distribution, it is possible to calculate corresponding area-based or volume-based distributions. While these converted distributions are derived from the same underlying data, the resulting curves can differ substantially in shape. When viewed without context, these differences can lead to the incorrect assumption that the results themselves differ.
This effect is particularly relevant when comparing data from different instruments or techniques. To make valid comparisons, particle size data must be presented and evaluated using the same distribution base.
Effect of Distribution Base on the Shape of Particle Size Distributions
Instruments that measure individual particles, such as Hyperion Analytical’s Envision Nanoparticle Tracking Analysis (NTA) or microscopy-based techniques, naturally produce number-based particle size distributions. From these measured number-based data, it is possible to calculate corresponding area-based and volume-based distributions.
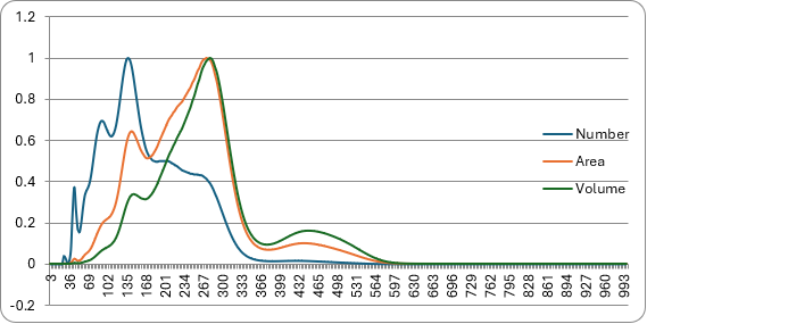
Figure: illustrates this effect using a single dataset that has been plotted using different distribution bases. Although the underlying particle measurements are identical, the resulting curves differ substantially in shape depending on whether the data are displayed on a number, area, or volume basis.
In the number-based distribution, smaller particles dominate the plot because each detected particle contributes equally, regardless of size. When the same data are converted to an area-based or volume-based distribution, larger particles contribute disproportionately due to their increased surface area or volume. As a result, peaks corresponding to larger particle populations become more prominent, while smaller particle populations may appear reduced or obscured.
These differences do not represent different measurement results, but rather different mathematical weightings applied to the same dataset. Without careful attention to the selected distribution base, such plots can easily be misinterpreted as representing different particle populations.
This effect is particularly important when comparing particle size data obtained from different instruments or analytical techniques. Meaningful comparison requires that data be viewed and evaluated using the same distribution base, as differences in presentation alone can lead to incorrect conclusions.
Relevance of Number-Based Distributions for Nanoparticle Applications
For nanoparticles, the ratio of surface area to volume increases rapidly as particle size decreases. At small sizes, surface chemistry therefore plays a dominant role in particle-particle interactions and functional behavior.
In applications where individual particles act as discrete functional units, a number-based distribution is often the most appropriate representation of the data. Examples include reactions catalyzed by individual seed particles and viral applications, where each virus particle represents an active agent. Aggregate detection is also more concerned with the relatively few large particles. In these cases, the total number of particles is a primary parameter of interest.
Conversion of Volume-Based Data to Particle Number
There are situations in which a user may wish to obtain a number-based distribution from an instrument that naturally measures particle populations on a volume basis. Such conversions are performed by dividing the total measured volume within each size range by the calculated volume of a single particle in that range.
Although mathematically straightforward, this approach introduces substantial uncertainty, particularly at the lower end of the size distribution. Small volume contributions from fine particles can produce extremely large calculated particle numbers, even though those particles were not directly measured. As a result, errors in the volume measurement or size estimation are amplified when converting to particle number.
For this reason, number-based distributions calculated from volume-based measurements should be interpreted with caution, especially for nanoparticle samples.
Intensity-Based Distributions in Dynamic Light Scattering
Dynamic Light Scattering (DLS) characterizes particles by measuring fluctuations in scattered light intensity and naturally reports particle size data on an intensity-weighted basis. The scattered light intensity from a particle is proportional to the sixth power of its diameter (d⁶).
This strong size dependence means that relatively small numbers of large particles can dominate the reported distribution. For example, a single 100 nm particle produces the same scattering intensity as approximately one billion (10⁹) particles with a diameter of 10 nm.
This behavior differs significantly from NTA, where a volume-based comparison would require only 1000 (10³) particles of 10 nm diameter to equal the mass contribution of a single 100 nm particle. As a result, polydisperse samples frequently produce substantially different size distributions when measured by DLS and NTA.
It is also important to note that in microscopy-based measurements, particles of different sizes are weighted equally by number, despite large differences in mass and scattering intensity. This further illustrates how the choice of distribution base influences the apparent particle size distribution.